Learn More About Data and AI
Explore your next career challenge and learn more about the Data and AI team!
Learn More

We’re continuing our look at the “Deadly Dozen” data science mistakes—the costly errors my colleagues and I have seen derail analytics projects. Last time we explored the foundational problem of lacking crucial data (Mistake 1). Now we turn to another common hazard: the urge to squeeze every drop of performance out of the data in front of you, inadvertently crippling the model for cases the future will throw at it.
It’s natural to judge a model by how well it handles the information it was built on, but to prove it works, it must be tested against data it has never seen before. Those out-of-sample (OOS) results are all that matter. If you instead seek to best fit the training data, then a trivial lookup table (which memorizes the data rather than finding patterns) will always win. Your goal should be to build a model that performs well on similar but never-before-seen cases.
Three decades ago, I was invited to meet with researchers at the UT MD Anderson hospital in Houston. They were trying out the then-hot method of neural networks to detect cancer. Their out-of-sample results were fairly accurate, though worse than training (as is the norm). They had been training networks for one full day and believed that longer training would improve results – after all, that’s the way it works with doctors.[1] Instead, they were astonished to find that training for a full week led to only slightly lower training error and much worse evaluation error. This was a classic case of overfit. Obsessing on training accuracy focused the model so much on the details of the data sample that it failed to learn general lessons for the real world. When a model overfits, it memorizes the historical noise and exact details of the past instead of discovering the underlying rules needed to predict the future.
A common temptation for new practitioners is to refine a model until it achieves an exact fit on known data. That is virtually guaranteed to lead to overfit. Look at Figure 1 below as an example. It shows a one-dimensional function (the red line) sampled at 10 points (the dark blue diamonds), and the polynomial equations (with increasing powers of x) fit by regression. The most complex model fits the training data most closely but oscillates wildly, poorly estimating values everywhere else.[2]
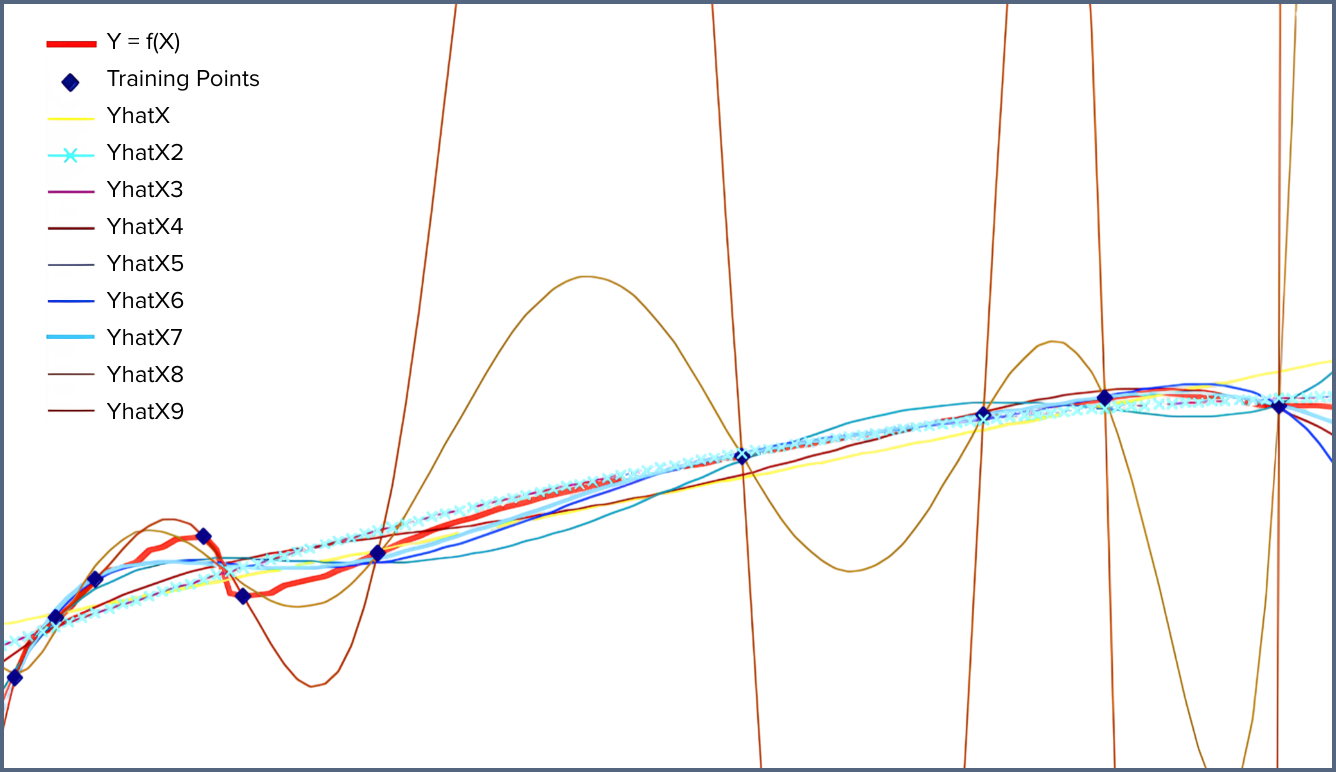
It has been known for centuries that making a model more complex improves training error but eventually worsens evaluation error[3]. Model-selection metrics that penalize a weighted combination of error and complexity can be useful to obtain good models. I used these heavily in my early career and found that the metrics with the harshest complexity penalties were the most useful – for example, the Bayesian Information Criterion and the elegant Minimum Description Length measure based on information theory[4]. In practical terms, these are mathematical rules that force the model to stay simple, automatically rejecting complex equations unless they significantly improve accuracy. But I eventually learned to rely solely on direct OOS measurements using resampling—a technique that repeatedly shuffles and re-tests the data you already have.
A single split of the data into training and evaluation sets is the most popular evaluation approach. However, it’s surprising how different the error measure can be between two ways of splitting. Cross-validation (and other resampling methods like bootstrap, jackknife and leave-one-out) provides reliable OOS error estimates by splitting, fitting, and scoring the data multiple times to obtain a distribution of OOS results. Instead of relying on one single test, this method repeatedly divides your historical data, building the model on one section and verifying it on the hidden section to guarantee consistent performance. The mean (or median) of that distribution becomes your error estimate, and the standard deviation (or inter-quartile distance) represents your confidence in that estimate. The mean tells you the average accuracy you can expect, while the standard deviation reveals your operational risk—how wildly that accuracy might fluctuate when deployed.
Note that the five different models can reveal additional insight, such as which variables are most important. To get the parameters for your final model, it is most common to train on all the data and have it inherit the OOS metrics as its estimate of future performance.
Traditional statistical significance tests are too weak to assess quality. Because they were designed for rigid theoretical situations, these tests easily break down—especially when the model structure is part of the search process. Resampling is more accurate and doesn’t require you to specify data or error distributions. In practice, this prevents a lot of worry and hesitation.
Note that resampling evaluates whatever is held constant throughout all the iterations (often called folds). For instance, if you set the structure (terms) of a model and only search for its parameter values over multiple data subsets, then the accuracy results would apply to that fixed model structure. If you instead allow terms to be selected during the model search (such as happens with decision trees or stepwise regression—algorithms that automatically select the most important variables), then the resampling procedure evaluates that modeling choice[6]. The higher complexity of an approach allows better training results but doesn’t guarantee better OOS results, which is what resampling collects.
For new practitioners, the most confusing part of resampling is that it creates multiple overlapping models. Which should you use? The popular choice is to train the final model using all the data and have that resulting model inherit the accuracy properties measured by the earlier cross-validation folds. Another approach, which is often more accurate, is to combine the multiple models in an ensemble by, for instance, averaging their outputs[7]. This strategy often works because the analytical blind spots of one model can be covered by the strengths of another, leading to a more accurate overall result.
Lastly, over-emphasizing training performance suggests that you are treating the training data as a comprehensive representation of the reality under study. In practice, a data sample rarely captures the full complexity of the underlying problem. Often, some important types of cases are missing or underrepresented (see Mistake 1: Lack of Crucial Data), and/or contextual information—completely outside the data—is vital to success (as will be emphasized in Mistake 5: Listen Only to the Data). Remember that the training data is a noisy partial window into reality and rarely rewards being pushed too hard.
Once you have secured the right data and resisted the urge to overfit, you face another hazard. It’s human nature to settle on a favorite method and blindly apply it to every problem. Next time, we will examine Mistake 3: Rely on One Technique. We’ll explore the unique strengths and weaknesses of different modeling methods and why you should let multiple models teach you something—even if you don’t ultimately use all their predictions.

Explore your next career challenge and learn more about the Data and AI team!
Learn More