

24.07.2026

With data and AI projects, some of the biggest challenges are related less to data than to human nature. In our last “Deadly Dozen” installment [1] (Mistake 2), we tackled the temptation of overfitting and why cross-validation is a powerful tool to prove your model works. Now, we turn to another common trap: Mistake 3: Rely on One Technique.
“To a little boy with a hammer, all the world’s a nail.” You’ve probably worked with a colleague who always believes the solution to a problem is the type of analysis they know best! Many researchers and practitioners focus on developing expertise in a single modeling technique, but for best results, learn to be adept at using a diverse toolkit.
At the very least, be sure to compare any new and promising method against a stodgy conventional one, such as linear regression (for estimation) or linear discriminant analysis (for categorization). About thirty years ago [2], a study of 3-years’ contents of a neural networks journal found that five of every six of its peer-reviewed articles either looked only at training data, didn’t compare results against a baseline method, or made both of those mistakes. Obviously, conference papers and unpublished experiments, which are subject to much less review, are even less reliable!
Trying only one modeling method leads one to credit or —blame— it for the results. But many problems are either very easy or very hard for all techniques. Often, the choice of modeling technique makes less difference than the expertise of the practitioner or the inherent difficulty of the data.
In addition, the true variety of modeling algorithms available is much less than the apparent variety, as many methods devolve to variations on a handful of elemental forms.[3] However, there are real differences in how each of those elemental forms “connects the dots” of the training data to make a prediction.
Figure 1 illustrates example response surfaces (or 3D predictive landscapes) for five different methods —decision tree, polynomial network, Delaunay triangles (which I invented), adaptive kernels and nearest neighbors— on (different) two-dimensional input data. For instance, decision trees create models with detached rectangular planes, whereas neural networks build smooth nonlinear surfaces. Clearly, a given method can have characteristics more appropriate than others for a given problem; that is, a truly distinct modeling method might best match the “structure” of relationships in the data.
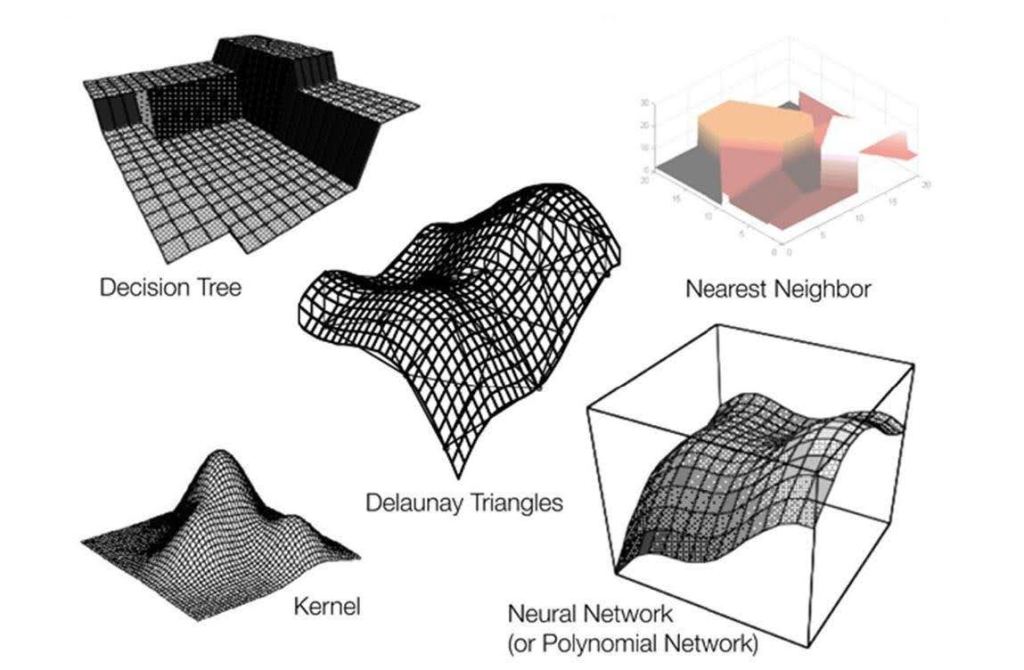
Figure 1. Representative response surfaces for five different modeling methods. The latitude and longitude of a figure are the two input dimensions, and the altitude is the output. The underlying data is different for each figure.
Figure 2 reveals this performance issue graphically [4]. The relative error of five different methods neural network, logistic regression, decision tree, linear vector quantization and projection pursuit regression is plotted for six different problems from the Machine Learning Repository [5]. Note that “every dog has its day”; that is, that every method is first or second on at least two problems [6]. On this set of experiments, neural networks won, but how does one predict beforehand which technique will work best for a new problem? Rather than trying to predict the perfect modeling method for a given problem, it’s best to try out a handful of good tools.
Wrangling the data from its natural chaotic state into a useful matrix usually takes the most time. From there, running another algorithm you’re familiar with and analyzing its results adds only 5-10% more effort. (But to your client, boss or research reviewers, it may appear like twice the work!) Once you get comfortable trying several methods, you can even start combining them – a topic I cover in my book on Ensembles and one we’ll explore later in Mistake 12: Believe the Best Model.
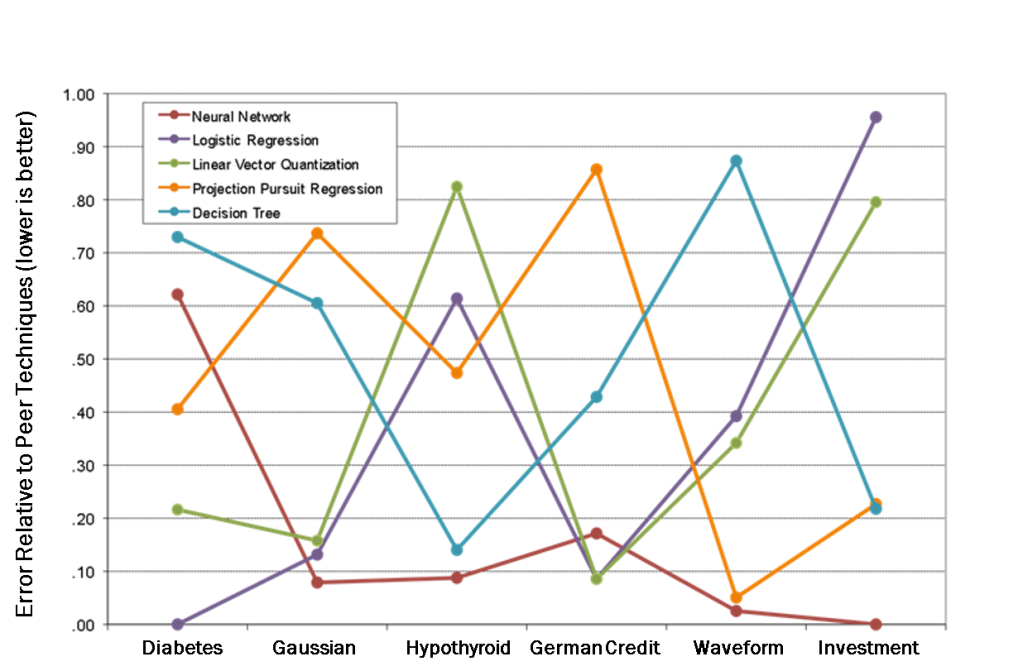
Figure 2. Relative performance of five algorithms on six data sets. The winning algorithms have the least relative error. For instance, logistic regression won for the diabetes problem.
Even if you don’t use a model’s estimates, it can still teach you valuable things about the data. For instance, friends of mine were asked by their client to review a neural network they’d built to forecast interest rates, as its performance (95% accurate) seemed too good to be true. It took three days to find the problem (as neural networks are very difficult to interpret): one of the input variables was perfectly correlated with the output! That is, it was an illegal variable – a “leak from the future” (“Deadly Dozen” Mistake 6). Had anyone tried a simple regression model that flaw would have been instantly revealed. It was extremely hard to discover using neural networks alone.
Decision trees are usually the least accurate modeling method, but the best versions (like CART, a powerful tree-building algorithm) have many other positive qualities.
Traits of the Top Tree Algorithms
I now use decision trees less for overall modeling and more as a great way to isolate and highlight weird data subsets. For instance, when we were working to solve a client’s upselling problem, a decision tree isolated a subset of cases into a specific node, or bucket, that had performance too good to be true. Those were the cases for which a categorical variable’s value was filled in instead of left blank. It took some time to confer with the client and review the data extraction process to discover that the categorical variable was a leak from the future and not possible to use in modeling. Had we stuck with using only global modeling methods, like regression or neural nets, that insight would’ve been essentially impossible.
Lastly, methods that automatically select variables, like decision trees or stepwise regression, can greatly improve the performance of methods that use all the variables, like nearest neighbors or neural networks. Learning which variables are most useful to one technique often unlocks new levels of accuracy in a more complex model. For instance, it allows the computational power of a neural network to focus solely on the top variables rather than wasting effort minimizing the influence of noise variables.
Bottom line: Learn how to use multiple distinct modeling methods, try them all, get insights from each to help solve the problem in stages and try to combine the estimates from several models to achieve the best performance.
But even using a combination of different models will fall short if you aim them at the wrong target. Next time, we’ll examine: Mistake 4: Aim at the Wrong Target. We’ll explore how to properly align your project with a key business problem and craft success metrics that reflect real-world trade-offs.
[1] The “Deadly Dozen” Data Science Mistakes are adapted from Chapter 20 in my Handbook of Statistical Analysis and Data Mining Applications.
[2] About three decades ago, in the early stage of a renewed enthusiasm for neural networks.
[3] An excellent comparative study examining ~ 24 methods against as many problems is by Michie, Spiegelhalter, and Taylor, 1994. I reviewed this in JASA 1996. Nine of the methods turned out to be slight variations on decision trees. I liked that, armed with the matrix of results, the authors built a decision tree to predict which method would work best on a problem with given data characteristics. But ensembles work better.
[4] This study comes from joint work in the late 1990s with Professor Stephen Lee of the University of Idaho, who was expert in the “gating” method employing multiple models, a precursor to ensembles.
[5] In the graph the worst out-of-sample error for each problem is a value near 1 and the best is near 0. I arranged the problems along the X-axis left-to-right by increasing proportion of error variance. So, the algorithms’ answers differed least on the Pima Indians diabetes data and most on the (not real) investment data. The models were built by colleagues who were advocates of the techniques (using S essentially, an early version of R). Having proponents of a method contribute the model for that method greatly reduces the “tender loving care” factor that can skew studies of performance differences. The selected datasets are useful but overstudied, with many fewer cases in them than there are papers employing them! A later UCI ML repository collected larger and more realistic problems.
[6] When I used this colloquialism in a presentation in Santiago, Chile, the excellent translator employed a quite different Spanish phrase, roughly “Tell the pig Christmas is coming!” I had meant every method has a situation in which it celebrates; the translation conveyed the concept on the flip side: “You think you’re something, eh pig? Well, soon you’ll be dinner!” Much more memorable.