

19.11.2026

We’re continuing our look at the “Deadly Dozen” data science mistakes. In Mistake 6, we examined how information from the future can quietly contaminate a model. In Mistake 7, we turn to cases that stand apart from the rest of the data. Outliers can distort a model, reveal a problem in the data, or become the most important discovery in the analysis.
Below are graphs of the famous Anscombe’s Quartet: four pairs of variables that have very different relationships despite having identical key summary statistics (correlation = 0.85, MSE = 1.25, R2 = 0.67, and regression fit: yest = 3 + 0.5*x).
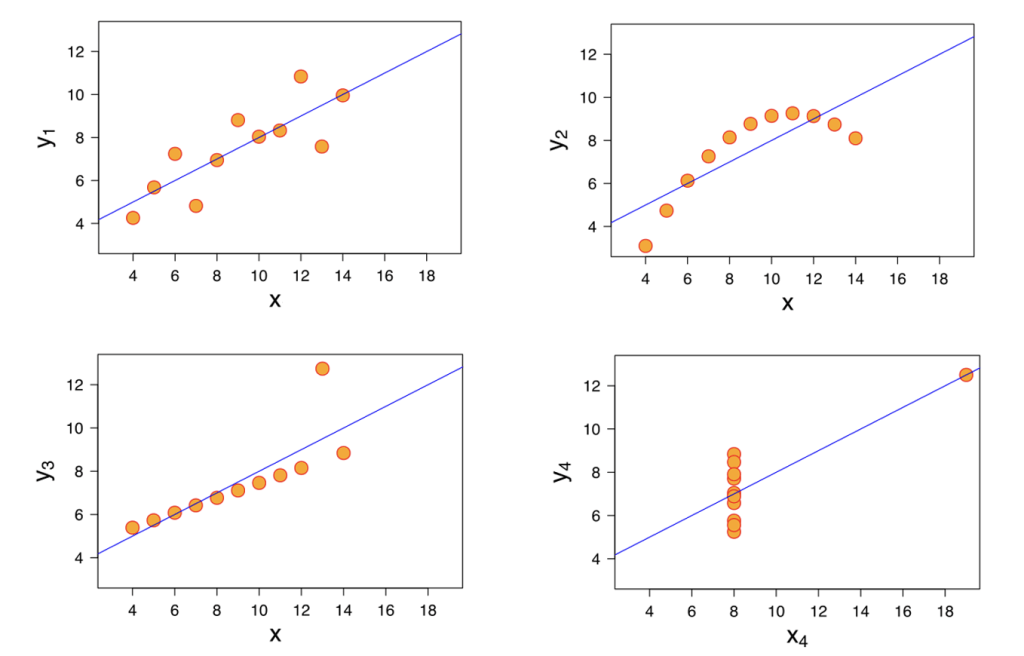
Anscombe’s Quartet: All four datasets have identical key summary statistics
In the third graph, an outlier in the Y variable has the highest error and disproportionate influence over the regression line because the errors are squared. In the fourth, an outlier in the X variable is a leverage point, as it has great influence (leverage) over its model’s coefficient values: wherever that point moves, the whole line follows.
Outliers and leverage points can seriously impact model-building; they can reverse, obscure, or even be the important result. An example of each kind is described next. The mistake is not simply keeping or removing an outlier; it is discounting an unusual case before understanding why it is unusual.
The challenge, then, is deciding whether an unusual case is an error to correct, a valid case to account for, or a clue worth investigating. To recognize when something is truly unusual, you first need some expectation of what should happen.
Isaac Asimov believed that the most exciting phrase in research is not “Aha!” or “Eureka!” but is “That’s odd…”. I heartily agree. And, to experience surprise, one must have expectations. So, it is useful to hypothesize beforehand how results will turn out from your experiments. If you wait until after the experiment, you can plausibly interpret nearly everything (which is not good).[6]
My colleague Stein Kretsinger, while a Masters engineering student at the University of Virginia, worked with a medical team to try to non-invasively monitor heart strength for juveniles. He presented some interim findings – unlabeled scatterplots on transparencies — to the doctor and nurse leading the research. They were happily interpreting the results when Stein realized, to his embarrassment, that he had placed the clear foils face side down, showing the reverse relationship of the variables. He sheepishly started over, flipping them right, only to hear the doctor say, “That makes sense too!”, as he interpreted the new (and completely opposite) implications.[7]
Humans are, and likely will remain, the best pattern-recognizers in existence – for the low dimensions in which we operate. But we are perhaps too good; we tend to see patterns even when they don’t exist. My colleague, Dustin Hux, worked at the Virginia State Climatology Office when a citizen sent in a videotape of purported cloud phenomena: “Could you weather experts explain the astonishing phenomena?”. The un-narrated three-hour tape contained nothing but typical summer (cumulus humilis) clouds. It reminded me of how our imagination will often perceive “dragons in the data clouds” when there are none.
A valuable step early in analysis is to seek to validate one’s data internally: do the variables agree with one another? Profile the data – looking for outliers, correlations, missing data, etc. – to learn about the data’s quality, suggest questions, and flag troublesome cases. Reliable analysis depends so strongly on the quality of the data that internal inconsistencies can hobble one’s work; or they can be clues to problems with the flow of information within the company and reveal a key process obstacle.
We worked closely with a direct mail client and dove deeply into their data looking for relationships between prospect information and orders. We found internal inconsistencies in who received catalogs, and our persistence in rooting out the cause temporarily endangered our relationship with the client! Eventually, we discovered that their “Merge/Purge house” was erroneously removing overseas purchasers from consideration, thus dropping some of their best prospects. This straightforward process correction was likely as helpful to the client’s bottom line as our high-tech modeling results.[8]
The examples above reveal how a simple mistake or even a single rogue case in a dataset can have enormous influence over a model. Don’t automatically discard the cases that don’t fit. Investigate why they are different: they may be errors to correct, valid cases that don’t belong in a particular analysis, or clues to something more important than the model you set out to build. In each scenario, human creativity and knowledge of the business context were essential to discovering the truth. I believe such expertise and creativity will always be needed to get the best answers, even as AI’s capabilities continue to grow.
[1] 800 could be due to a missing decimal point but I’d guess it’s from measuring in grams. (I know a premature infant who survived at ~1 lb. or ~500 grams.)
[2] AI can easily highlight possible outliers (extremes on distributions, for example), which would work well in this example. But I’m not aware of a tool that can yet reason about model implications using outside information.
[3] For example, a clerk lending out their buyer’s card sabotages later analysis. Unless the data scientist is aware of this danger multiple buyers will be conflated into one super-buyer. If the baskets of goods can be disaggregated by timestamps then some data can be used, but the valuable ability to link a sale to a single customer and their history will be lost.
[4] I heard this story in the early 1990’s when Prof. Aitchison started the Statistics Department at UVA. I had the great fortune of learning much from him. https://en.wikipedia.org/wiki/John_Aitchison
[5] https://www.bas.ac.uk/data/our-data/publication/the-ozone-layer/
[6] The astute reader will notice that I segued from odd cases to cases that make you say “that’s odd…”. But the latter is just a generalization of the former; outliers and leverage points are two straightforward examples of inconsistencies in a dataset. The challenge to their discovery is that there are so many ways for data to be unusual!
[7] Those who don’t regularly research with computers seem to give more credence to their output, we’ve noticed. Perhaps like sausage being enjoyed most by those least familiar with how it’s made.
[8] The analysis work, combined with operational changes such as higher-quality catalog paper, resulted in a doubling of the client’s average sales per catalog in the following year.